


A page from Court and Courtship: Indian Miniatures in the TAPI Collection by JP Losty(Amazon)
A decade after Proposition 47 was approved by Californians, many are questioning whether the crime-lenient bill has actually promoted “safe neighborhoods.” Below, algorithm analyst Ray Manning zooms in on Long Beach’s publicly available data, finding that: no, crime of all kinds has spiked in LBC post Prop 47.
Part 2. Methodology
The city of Long Beach has embraced open data and provides a web portal where a plethora of data is available for ordinary citizens to use. In addition, the Long Beach Police Department (LBPD) website provides a monthly tally of crimes reported in the city. The location of these crimes is provided in one of 282 police reporting districts within the city of Long Beach.
As part of the Uniform Crime Reporting (UCR) program, Long Beach separates their crimes into Part I crimes and Part II crimes. Part I crimes consist of serious crimes such as murder, homicide, rape, robbery, aggravated assault, burglary, larceny-theft, motor vehicle theft, and arson. Part II consist of simple assault, forgery, fraud, vandalism, stolen property, prostitution and vice, drug abuse violations, gambling, and driving under the influence. …Sign up to receive updates on Opp Now articles. Click HERE.
Part 3: Results
… There is both a visual jump in crime as new decarceration propositions are enacted and an increase in the average number of monthly crime incidents. Before Proposition 47 passed, the average number of monthly crime incidents in the city of Long Beach was 2083. After Propositions 47 and 57 passed, the average number of monthly crime incidents jumped to 2303 and 2683, respectively. (The average across all time periods was 2335.)

… Re-performing the calculations for average monthly crime levels including a three month lag period yields Figure 2. In this case, the average monthly crime reports are 2090, 2351, and 2710 for the Pre-Proposition 47 period, post-Proposition 47 period, and post-Proposition 57 period, respectively. (The average across all time periods was 2335.)

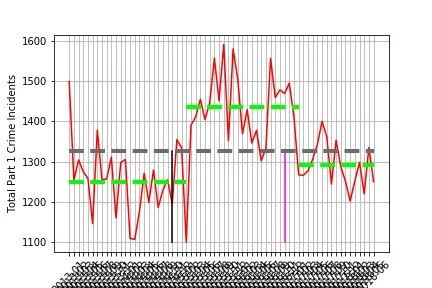
Is there a consistent increase in both the Part I crimes and Part II crimes as a result of the various propositions? Figures 3 and 4 show the Part I crimes and Part II crimes for the same time periods as discussed above. Recall that part I crimes are the more serious crimes.
The serious crimes shown in Figure 3 showed a large increase after the passage and implementation of Proposition 47 and then a “return to the norm” following the passage of Proposition 57. Average crime levels are 1249, 1434, and 1290, for the pre-Proposition 47 time period, the post-Proposition 47 time period, and the post-Proposition 57 time period.
On the other hand, the less serious crimes labeled as Part II crimes showed a moderate jump after the passage and enactment of Proposition 47 and then a large jump after the passage of Proposition 57. The average values for the three time periods are 841, 917, and 1420.

Read the whole thing here.
Follow Opportunity Now on Twitter @svopportunity